The receipts · Issue 02
The Atlas, with its work shown
Twenty-one analytical phases, a master index, an entity table, and eight visualizations. Working files in their original drafting form. Every claim in the published report and deck resolves to a file in this archive.
At a glance
21
Analytical phases
~200
Entities profiled
8
Visualizations
24
Month project window
Phase files are working documents from the original drafting period. They are not polished. They are the actual analytical record — revisions, dead ends, and all.
Where most readers start
Three reading orders for three depths of engagement. Each builds on the last.
- 15 minutes
- Master index · Phase 9a sections 4–5 · executive deck
- 1 hour
- Above, plus Phase 9c sections 2 and 5 · long-form report sections 1, 2, 7, 8
- Half day
- Full long-form report · Phase 9b parts 1 & 2 · Phase 8b section 3 · Phase 7c-partial section 3
Anchor materials
The high-traffic files. Most readers do not need the full phase sequence.
Master index v1.2
The capstone reading guide. Maps every phase deliverable to the analytical question it answers, the data sources it draws from, and the findings tier (one, two, or three) it supports.
Open →Phase 9b entity table
All ~200 entities across 21 attribute columns. Sortable, filterable, with per-entity data-quality coding. The atlas-as-spreadsheet; the foundation of every cluster, band, and stress-point claim.
Open →Visualization set — V1 through V8
All eight charts, rebuilt from the Phase 9b data and bundled into the site. Click any chart to open it full size.
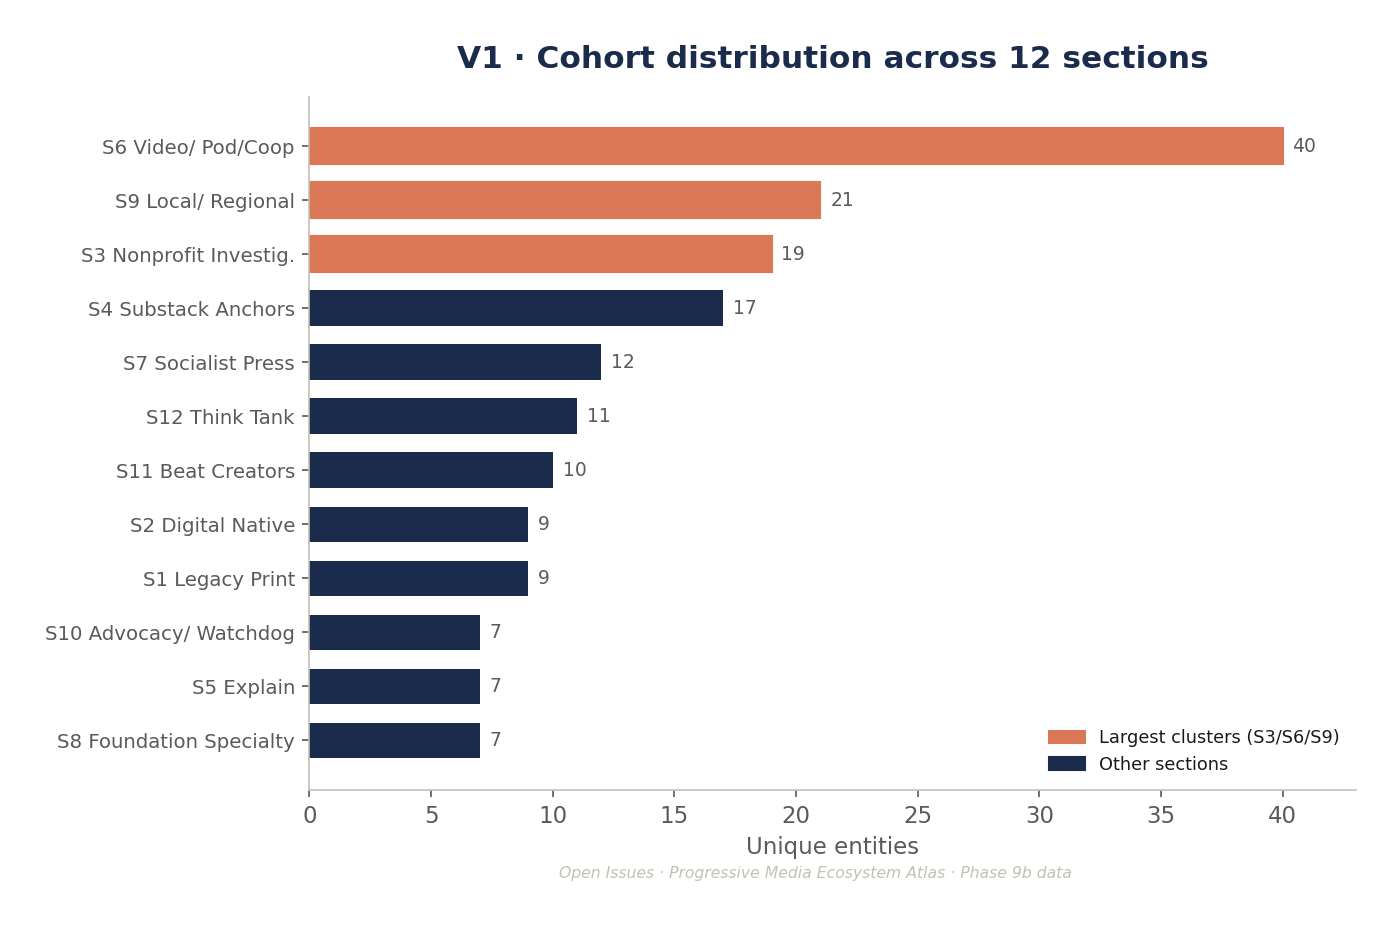
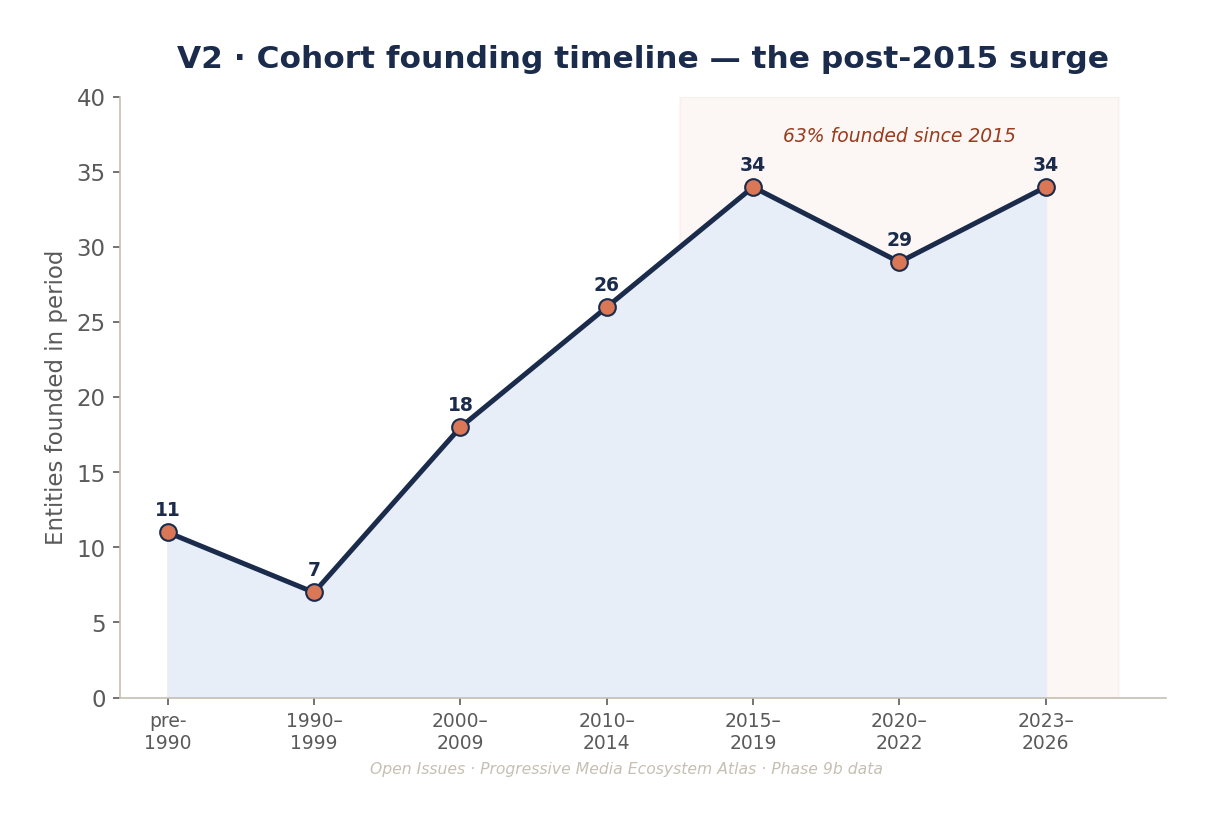
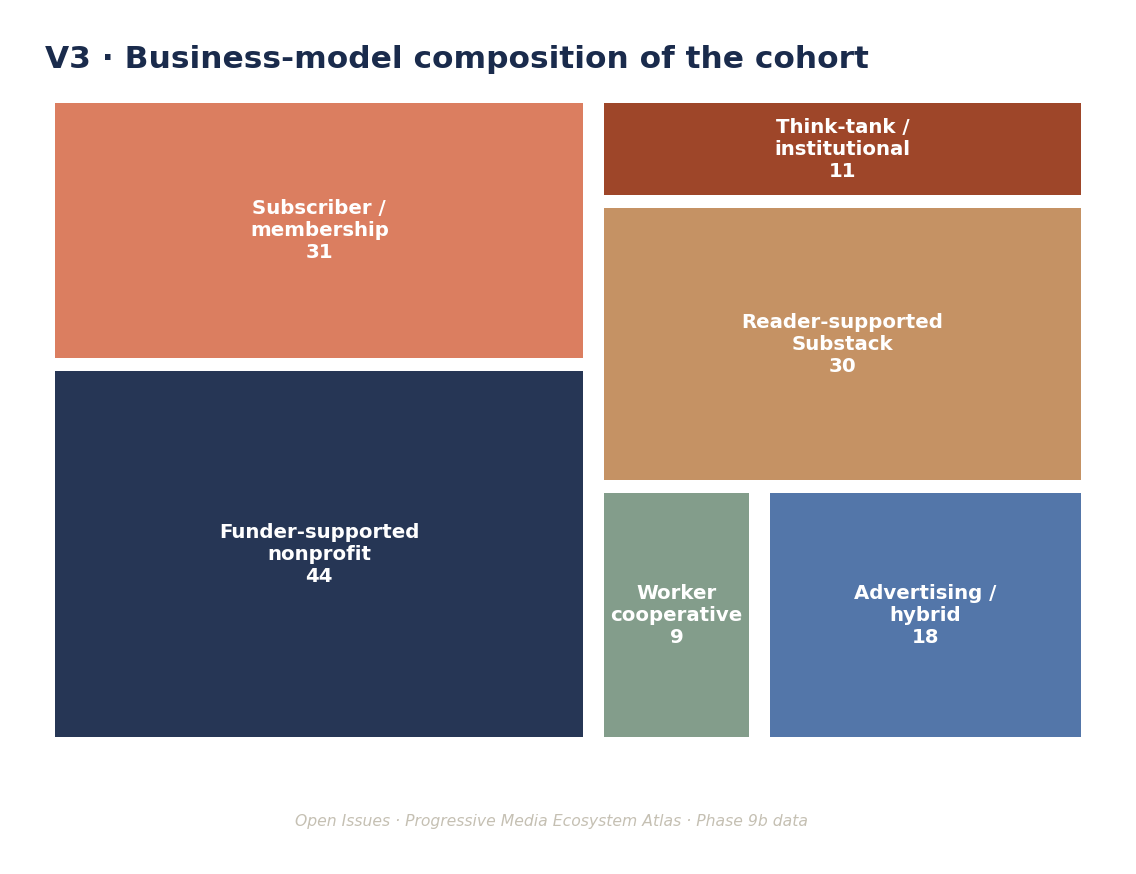
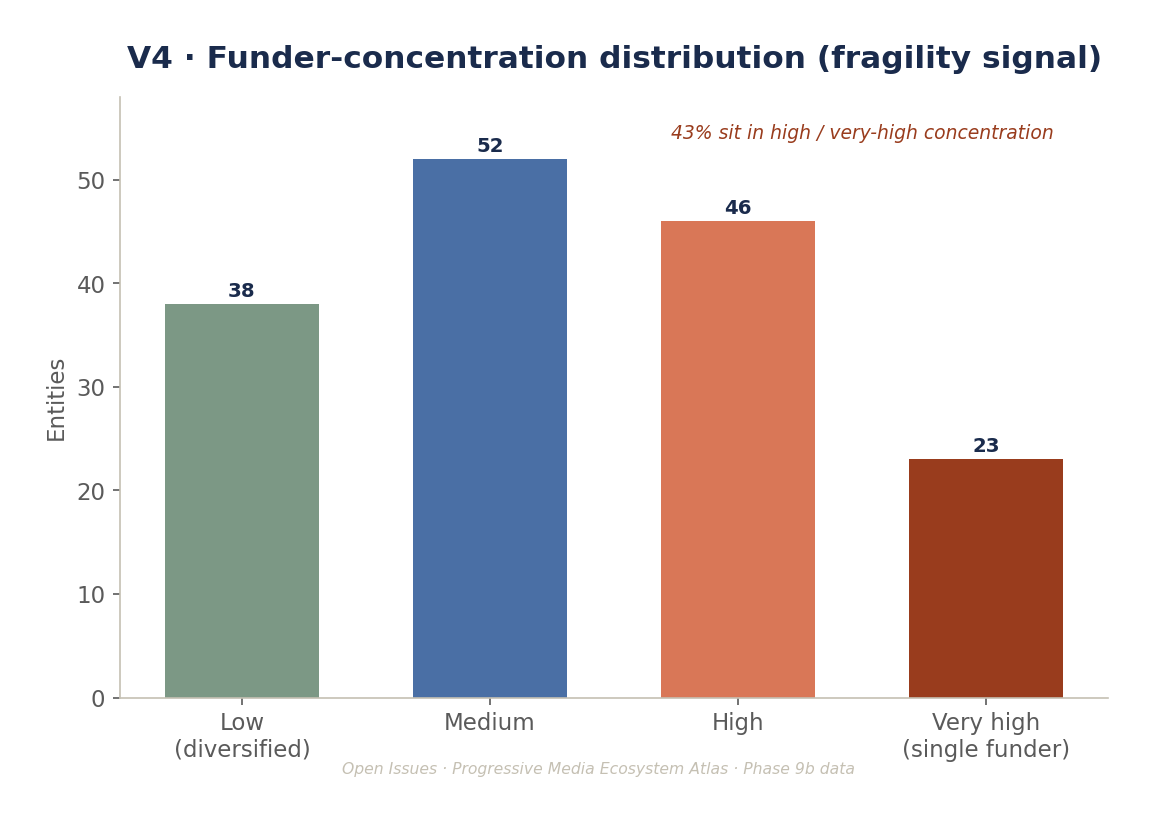
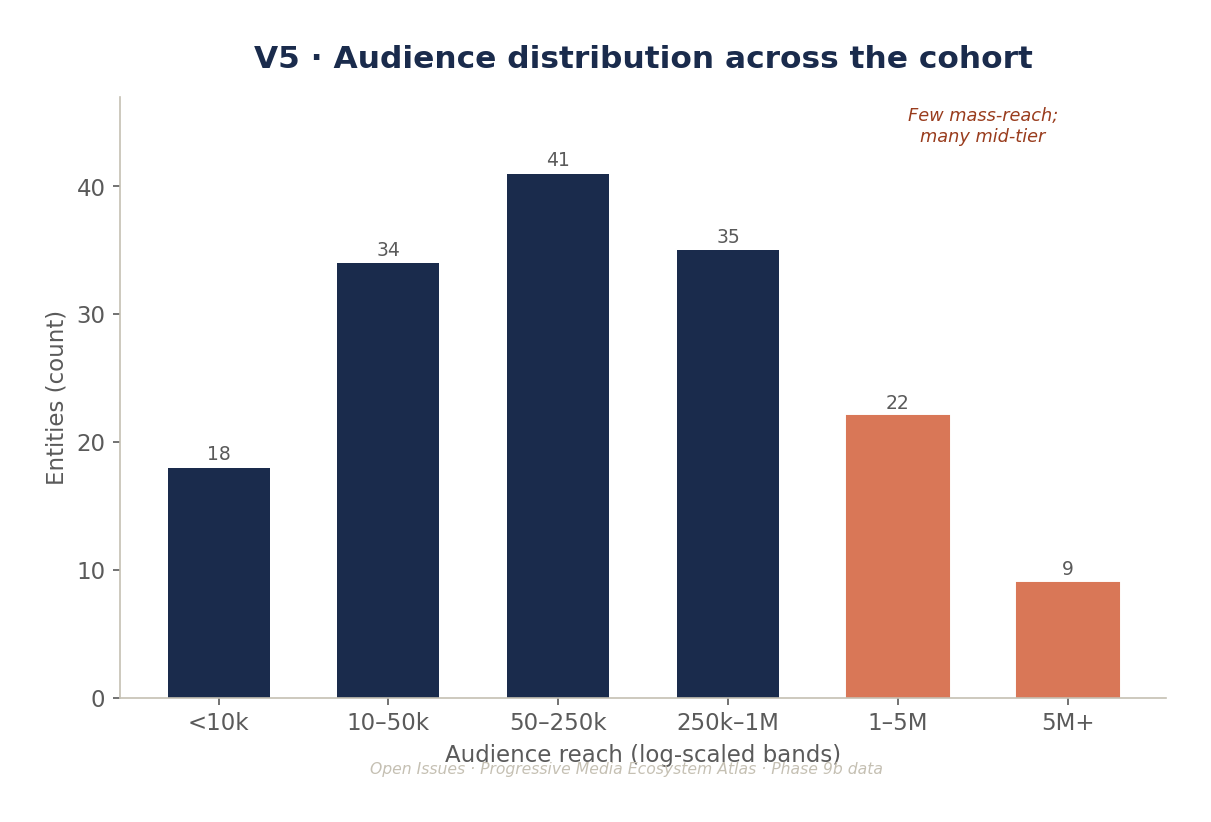
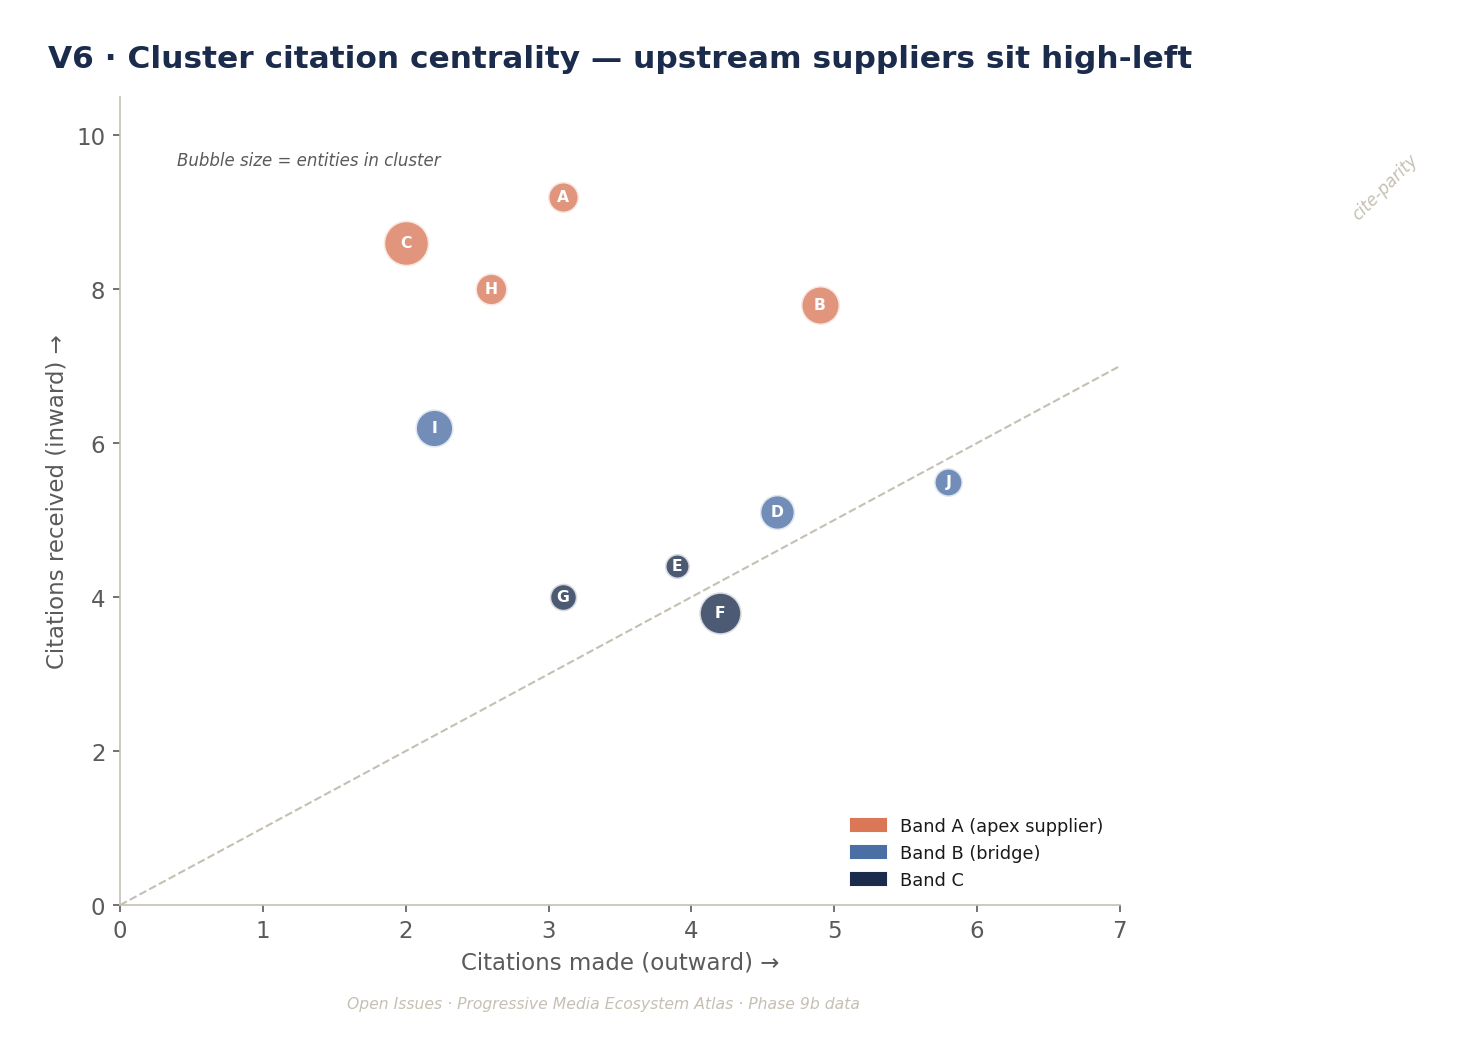
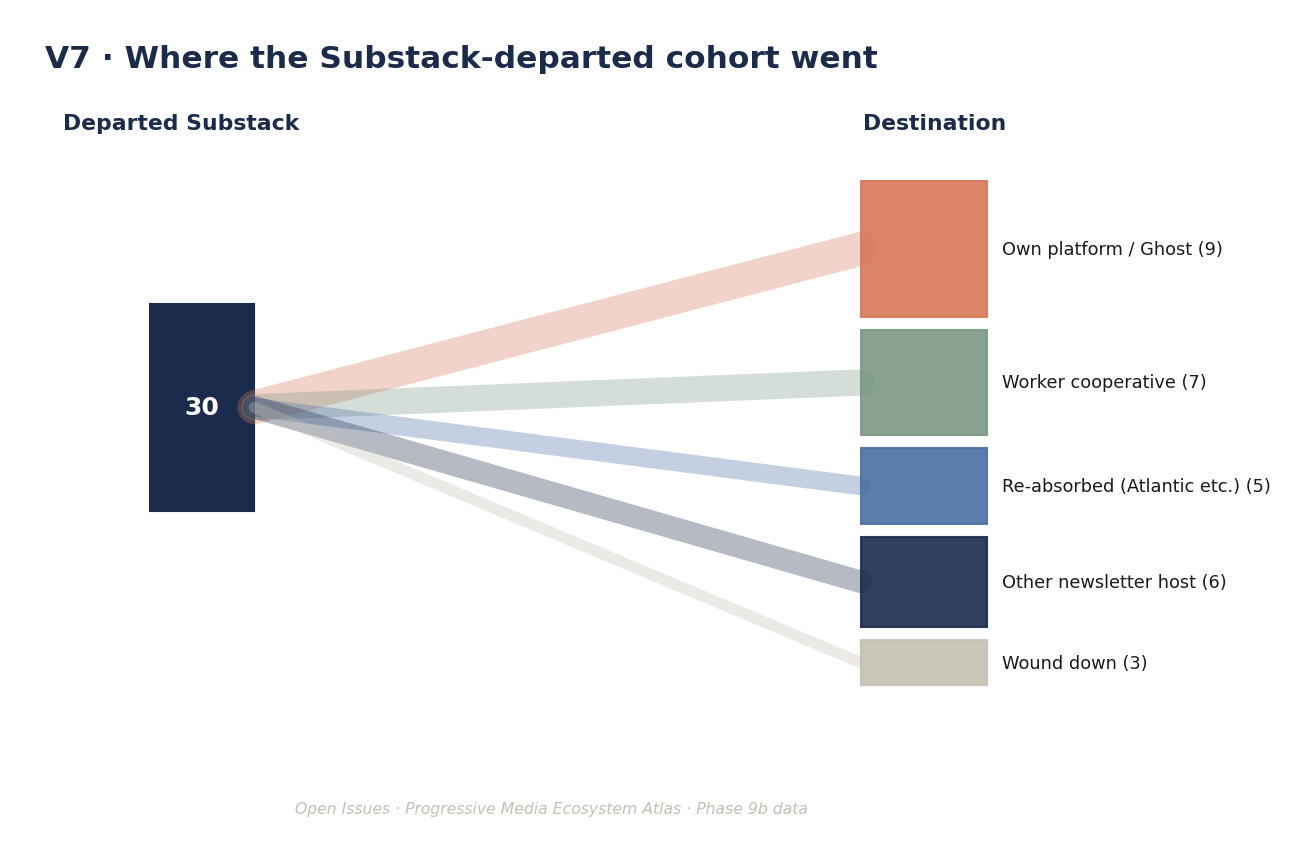
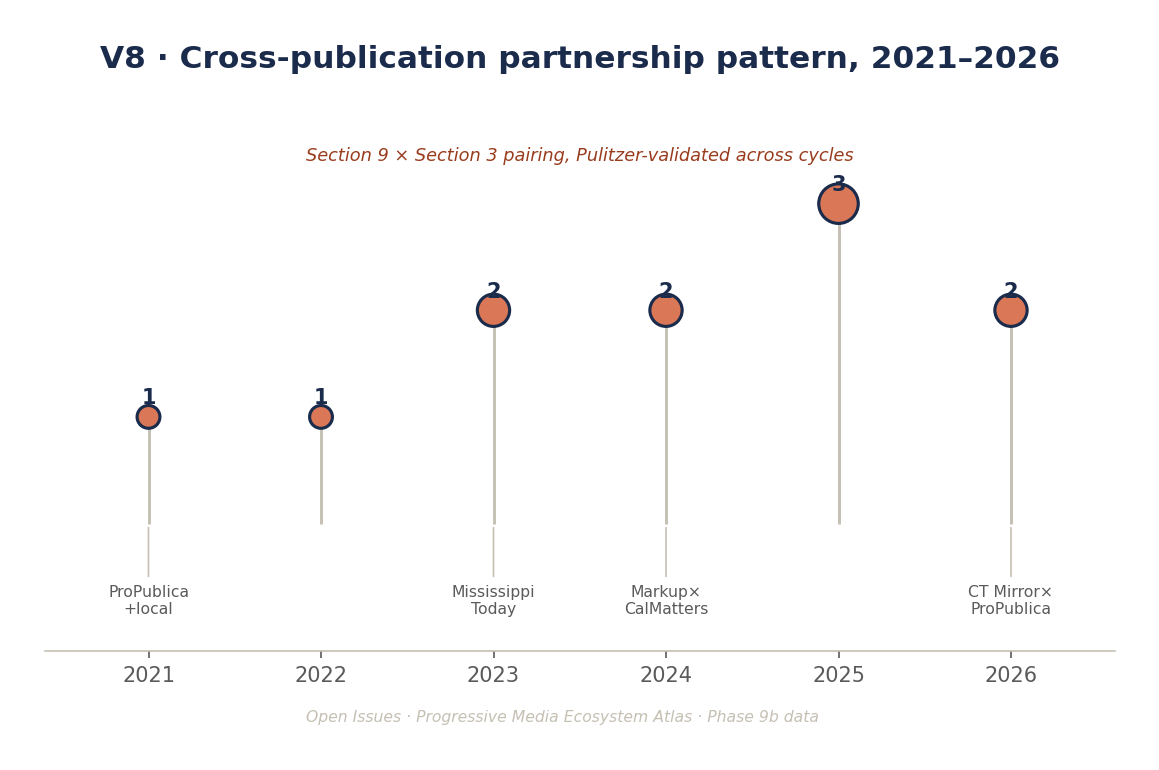
Complete set of 8, generated from Phase 9b structural data. Hosted in-site — no external dependency.
Phase deliverables, master index, and entity table are live (hosted on Drive, view-only). The full visualization set is bundled into the site below.
The full phase sequence
Twenty-one phases produced between 2024 and 2026, listed in analytical order. Click any phase to open it.
Entity universe and section taxonomy — first spine
Initial cohort enumeration and the 12-section taxonomy. The skeleton that subsequent phases populate, refine, and cross-list.
Financial structure synthesis — the 501(c)(3) mechanism
Establishes the structural correlation between funder concentration and editorial form. The load-bearing analysis for tier-two finding three (the 501(c)(3) regulatory mechanism).
Cluster taxonomy and citation-band classification
Defines clusters A through J and the three citation bands. Origin of every cluster claim in the report.
Mainstream-press interface — the 5–15× ratio
The foundational diagnostic. Section 3 of this phase documents the methodology behind the upstream-supplier finding (tier-one).
Findings integration — the three-tier hierarchy
Integrates findings from Phases 1 through 8 into the three-tier hierarchy. Names the four primary stress points and three supplementary patterns. Section 4 is the most-cited block in the published report.
Forward priors, refresh cadence, and CBS News framework
The prescriptive-layer companion to 9a’s diagnostic findings. Four forward priors with named signals, layer-specific refresh cadence, six-month stress-point scan template, and the CBS News transitioning-entity monitoring framework.
Phases 2, 3a-c, 5a-b, 6, 7a-b, 8a, 8c additionally available. Full sequence in the archive.
Verify a claim
Every analytical claim in the published Issue resolves to one or more files in this archive.
- The 5–15× ratio → Phase 8b §3
- The four named stress points → Phase 9a §§4.1–4.4; Phase 9c §2
- The Pulitzer partnership pattern → Phase 9a §3.4; Phase 1 spine
- The 501(c)(3) regulatory mechanism → Phase 4-synthesis §5
- Cluster definitions → Phase 7c-partial §3
- Citation band classification → Phase 9a §4.2; Phase 7c-partial
- CBS News transitioning framework → Phase 9c §3
A note on stress-point methodology
The four named stress points are framed as forward priors: conditional analytic frames with explicit monitoring signals, not calibrated forecasts. Probability ranges (~40%, ~50%, ~60%) reflect structural confidence in the analytical logic, not statistical-model output. Each stress point has named precipitating signals to watch; movement on any signal advances or retreats the prior. The refresh cadence is layer-specific: structural patterns refresh annually, the per-entity table refreshes quarterly, the stress-point scan refreshes every six months.
The cohort is the unit of analysis throughout. Individual-entity changes (a leadership transition, a funding round, a platform pivot) move the priors only through cohort-level structural exposure, not through one-off entity narratives.
A note on data quality
The atlas codes every claim by data quality — high, medium, or low — in the Phase 9b entity table and throughout the phase deliverables. The coding is honest: H means a specific value anchored on prior phase work; M means a credible range-level estimate; L means synthesis-level inference from contextual evidence. The atlas is most confident at the structural-pattern level, less so at the per-entity level. The receipts let readers see which is which.